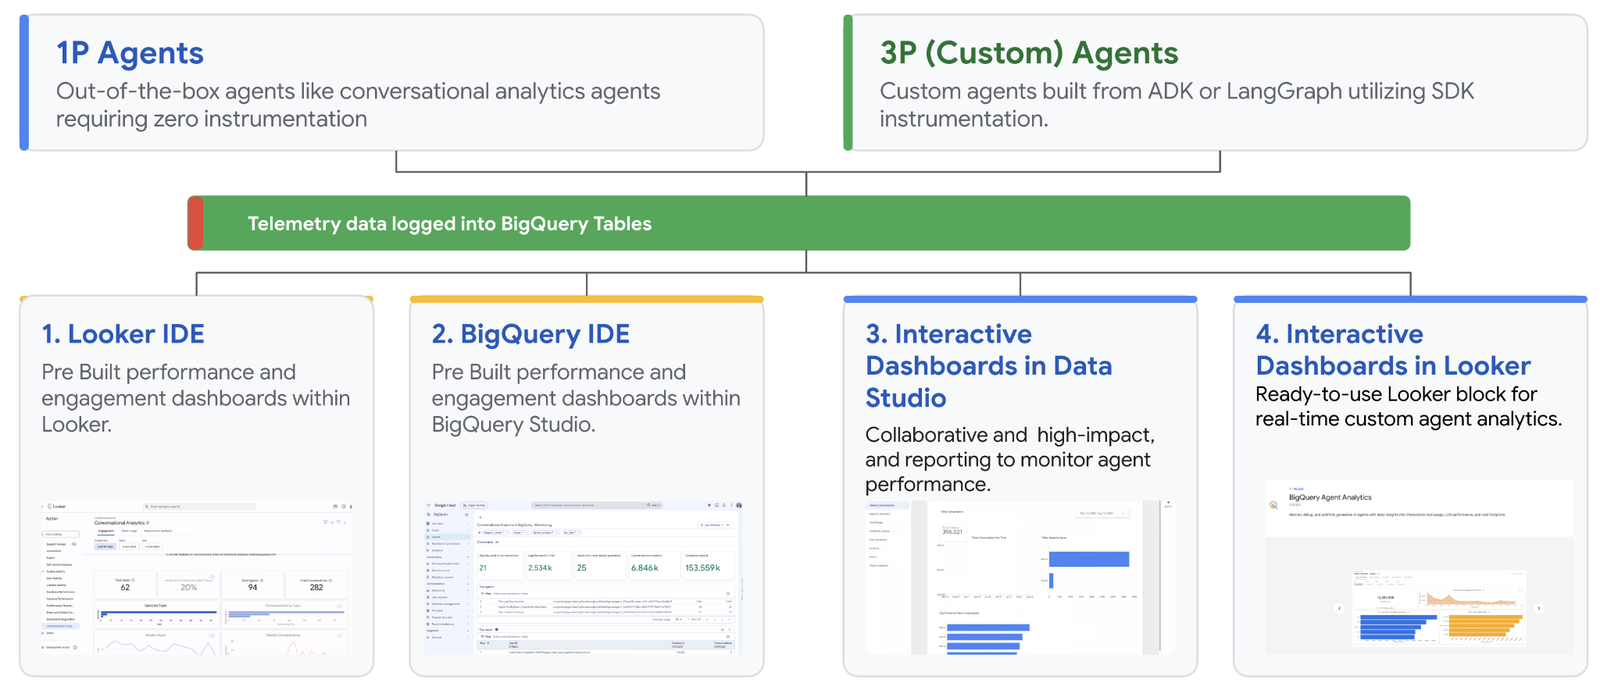
Google has announced expanded agent observability and evaluation across Google Data Cloud, with new capabilities in BigQuery and Looker. The announcement, published on the Google Cloud Blog on November 14, creates a single path to track how data agents reason, which data they touch, and what they cost to run — both Google's own agents and custom agents built with frameworks such as the Agent Development Kit (ADK) or LangGraph.
The idea is to treat agent observability as part of operations, not as an add-on: once an agent moves from prototype to production, teams need to see multi-step reasoning, protect sensitive data, control token consumption, and evaluate answer quality before a prompt or schema change reaches users.
One telemetry flow for every agent
At the heart of the announcement is a unified telemetry framework that works the same way for every agent: capture telemetry, land it in BigQuery tables owned by the customer, and analyze it wherever teams already work.
- Capture: first-party Conversational Analytics agents emit telemetry automatically, with no setup. Queries routed to BigQuery data agents in Gemini Enterprise through agent-to-agent (A2A) workflows, now generally available, send Cloud Monitoring metrics, Cloud Trace spans, and conversation logs straight into the agent's project. Custom ADK or LangGraph agents send the same structured telemetry with single-line SDK instrumentation.
- Destination: everything lands in the customer's own BigQuery tables, under the customer's permissions and governance rules, instead of being locked inside a third-party dashboard.
- Analysis: prebuilt dashboards in BigQuery Studio and Looker show usage, active sessions, top knowledge sources, latency, and token consumption. Teams can also build their own reports with an open-source Data Studio template or the Looker Block for Agent Analytics.
What is generally available and what is still in preview
Generally available now are conversation logging in BigQuery, the Conversational Analytics API, A2A workflows, monitoring dashboards in BigQuery Studio, and Looker System Activity dashboards, in both Looker (Google Cloud core) and Looker (original). In preview are user ratings and query review in Looker's Responses & feedback tab, daily input and output token quotas, and native agent evaluations in BigQuery, via API and a guided Colab notebook.
Operational telemetry kept separate from content
A central design point is separating operational telemetry from conversation content, so each layer has its own governance. Aggregate Cloud Monitoring metrics and sanitized Cloud Trace spans exclude the customer's core content: prompts, responses, internal thoughts, and generated SQL.
When auditing needs the content, conversation logging is opt-in, per agent: a Google-managed service agent streams prompts, responses, and turn-level telemetry into a customer-owned agent_events table via the BigQuery Storage Write API, inheriting the dataset's IAM permissions, customer-managed encryption keys (CMEK), and VPC Service Controls. The privacy guardrails are fail-closed: before each turn, the system skips logging whenever a knowledge source uses row-level security, column-level policy tags, or dynamic data masking. Execution, meanwhile, is fail-open: if logging fails, the user's session continues uninterrupted.
For custom agents, the open-source ADK plugin BigQueryAgentAnalyticsPlugin streams full tool-invocation trees, time-series telemetry, and multimodal payloads. And because the logs live in the customer's own table, failures can be diagnosed without building export pipelines: with BigQuery AI functions such as AI.GENERATE and AI.EMBED with VECTOR_SEARCH, or with the bigquery-agent-analytics Python SDK and a starter Colab notebook.
Cost control with FinOps guardrails
Each turn records input, output, thought, cached, and total token counts, plus total turn latency, while Looker System Activity reports estimated input and output tokens across business-intelligence workloads. To prevent billing surprises, teams can set a per-query BigQuery byte-scan cap (big_query_max_billed_bytes), which uses dry-run estimates to block oversized queries without incurring on-demand scan charges. Daily input and output token quotas, per project, user, or agent, are in preview. Google also notes that promotional trial pricing is currently available for Conversational Analytics.
Evaluation before shipping to production
Logs show how an agent behaved; evaluation shows whether a change improves or degrades answer quality. For that, Google released Prism, an open-source tool that tests Conversational Analytics agents grounded in BigQuery tables or Looker Explores, with reusable test suites, regex assertions, and multi-region discovery. Prism can stream evaluation results directly into day-partitioned BigQuery tables, next to production logs, for side-by-side comparison.
Context: Google accelerates its agent infrastructure
The announcement arrives in the same week Google launched A2UI 1.0, an open protocol that lets AI agents answer with interactive screens. Together, the two moves show Google's strategy for agents in production: on the surface, interfaces users can see; underneath, telemetry, governance, and cost control for the teams operating those agents.
Image credit: diagram of the unified agent observability framework, from the Google Cloud Blog.
Sources: Google Cloud Blog; Unite.AI.
Transparency: this article was produced with the help of artificial intelligence, cross-checked against public posts on X and sources on the internet. We recommend consulting the original sources for more details.
By Muse


