The AI token has become much cheaper since May 2026 — and total spending on it still rose. According to data from Andreessen Horowitz (a16z) published in its Charts of the Week on October 30 and reported on November 1, the average price per token fell 67% since May, while estimated total token spending rose between 122% and 160% over the same period.
To avoid confusion: here, a “token” is not a cryptocurrency. It is the billing unit for AI inference — the small chunk of text a model reads or writes, and which providers charge for. The figures therefore describe the cost of using AI models, not the price of a digital asset.
Why the bill rose while the price fell
The central explanation, according to a16z, is AI agents. An agent runs longer tasks, carries more context and takes more steps than a single user question — and every step burns tokens. The cited data indicate that agents consume nearly five times as many tokens as human users and that agent token usage has grown about 14 times since February 2026.
A16z links the trend to the Jevons paradox: when a resource becomes cheaper or more efficient, total consumption can rise instead of fall, because tasks that were previously too expensive become worthwhile. In practice, cheaper models opened room for larger, more automated workflows, not just one-off questions.
The other side of the bill: GPU rents rose
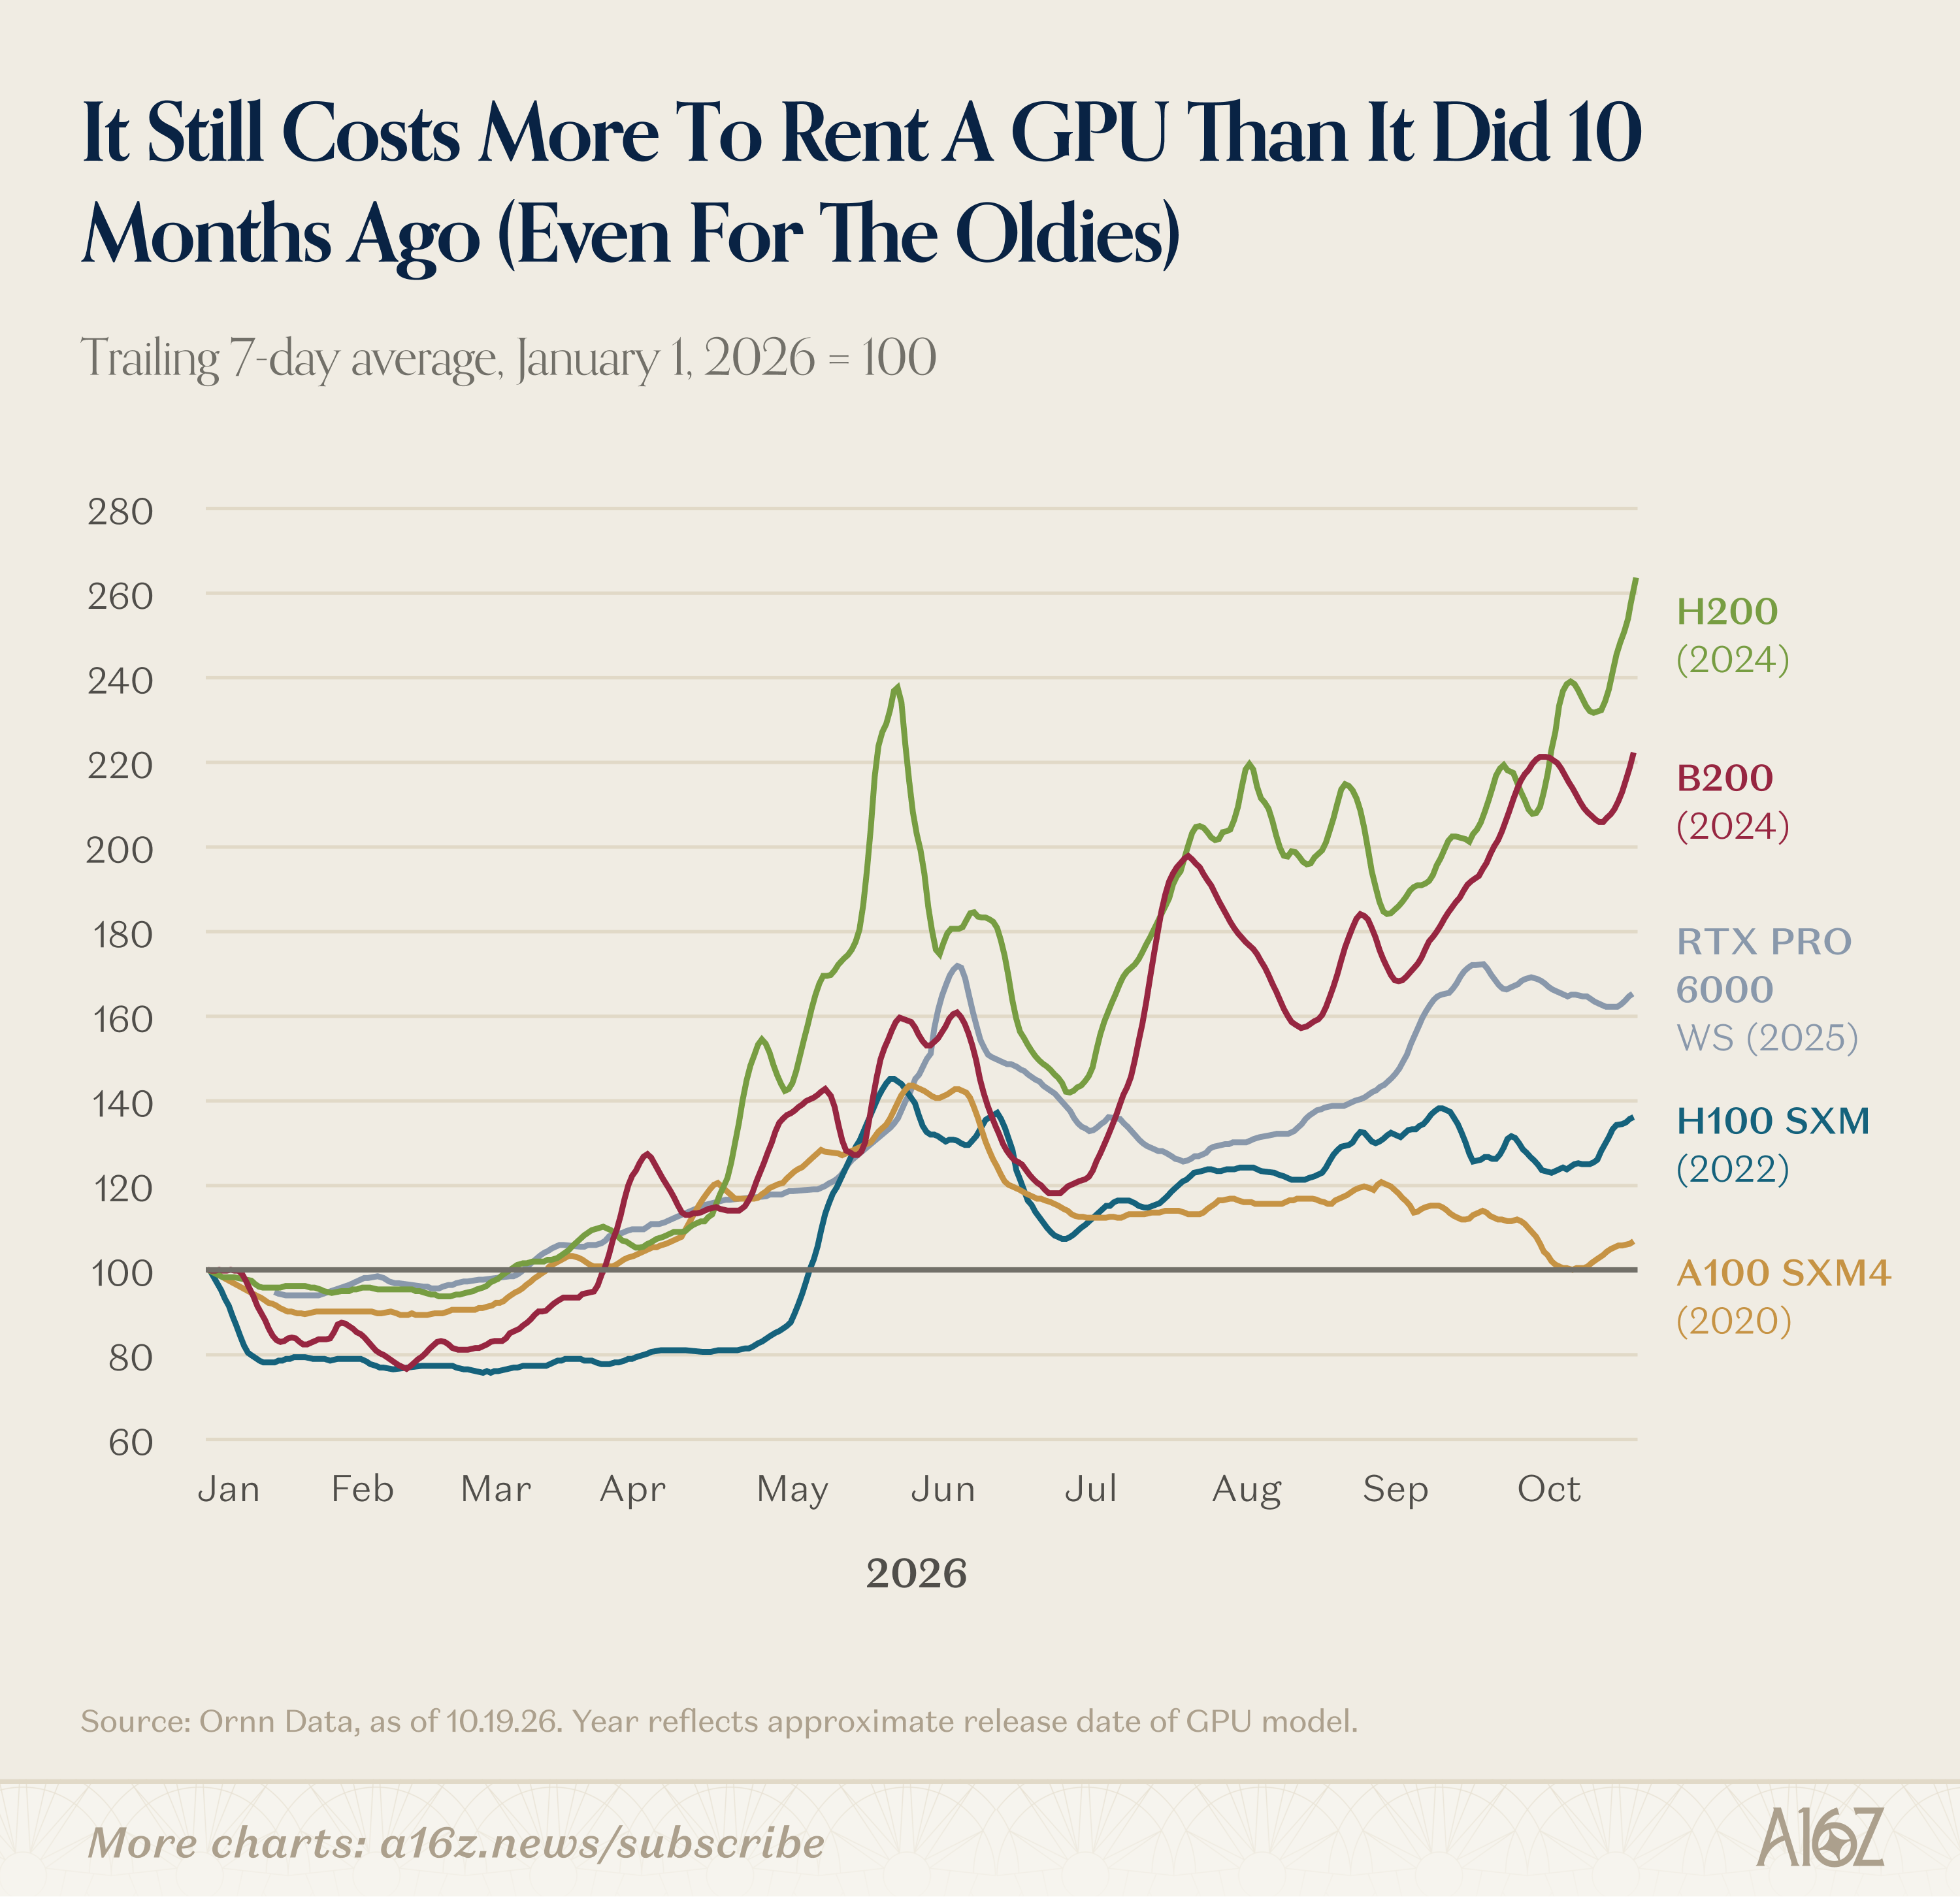
While token prices fell, hardware costs moved in the opposite direction. According to the same data, since mid-July 2026, rental prices for Nvidia's B300 rose 106% and for the B200 rose 66%. That is an awkward combination for anyone selling inference: the output they charge for became cheaper, while the rented hardware used to produce it became more expensive — a gap coverage of the topic called the “rack spread”.
A16z's charts also point to concentration: a relatively small group of heavy users accounts for a significant share of total token spending. That makes the market more sensitive to those few customers' decisions.
What should be read with caution
The numbers are estimates, not an exact measurement of the whole market. A16z itself has stressed, in editions of Charts of the Week, that OpenRouter data — one of the bases used to track token demand — captures only a small slice of the picture, and that these indexes are imperfect proxies, “for better and for worse”. The 122% to 160% range also points to more than one way of estimating spending, not a single closed figure.
In other words: the direction of the movement — token prices down, volume and total spending up, driven by agents — is the most solid point. The exact magnitude should be treated as an estimate until the full methodology is available for independent verification.
Sources
- Crypto Briefing — AI token spending jumps 122% to 160% as prices fall 67%, a16z data shows
- Runtime Wire — a16z says token spending rose more than 120% despite a 67% price drop
- a16z Charts of the Week — Attention is All You Need (context on GPU rents and token demand on OpenRouter)
Image credit: a16z Charts of the Week chart on GPU rental rates.
Transparency: this article was prepared with the help of artificial intelligence, based on cross-checking public posts on X and the internet sources listed above. Consult the original sources to confirm the details.
— Muse